

Behind the acceptance letter: How UCLA admissions have shifted over 30 years
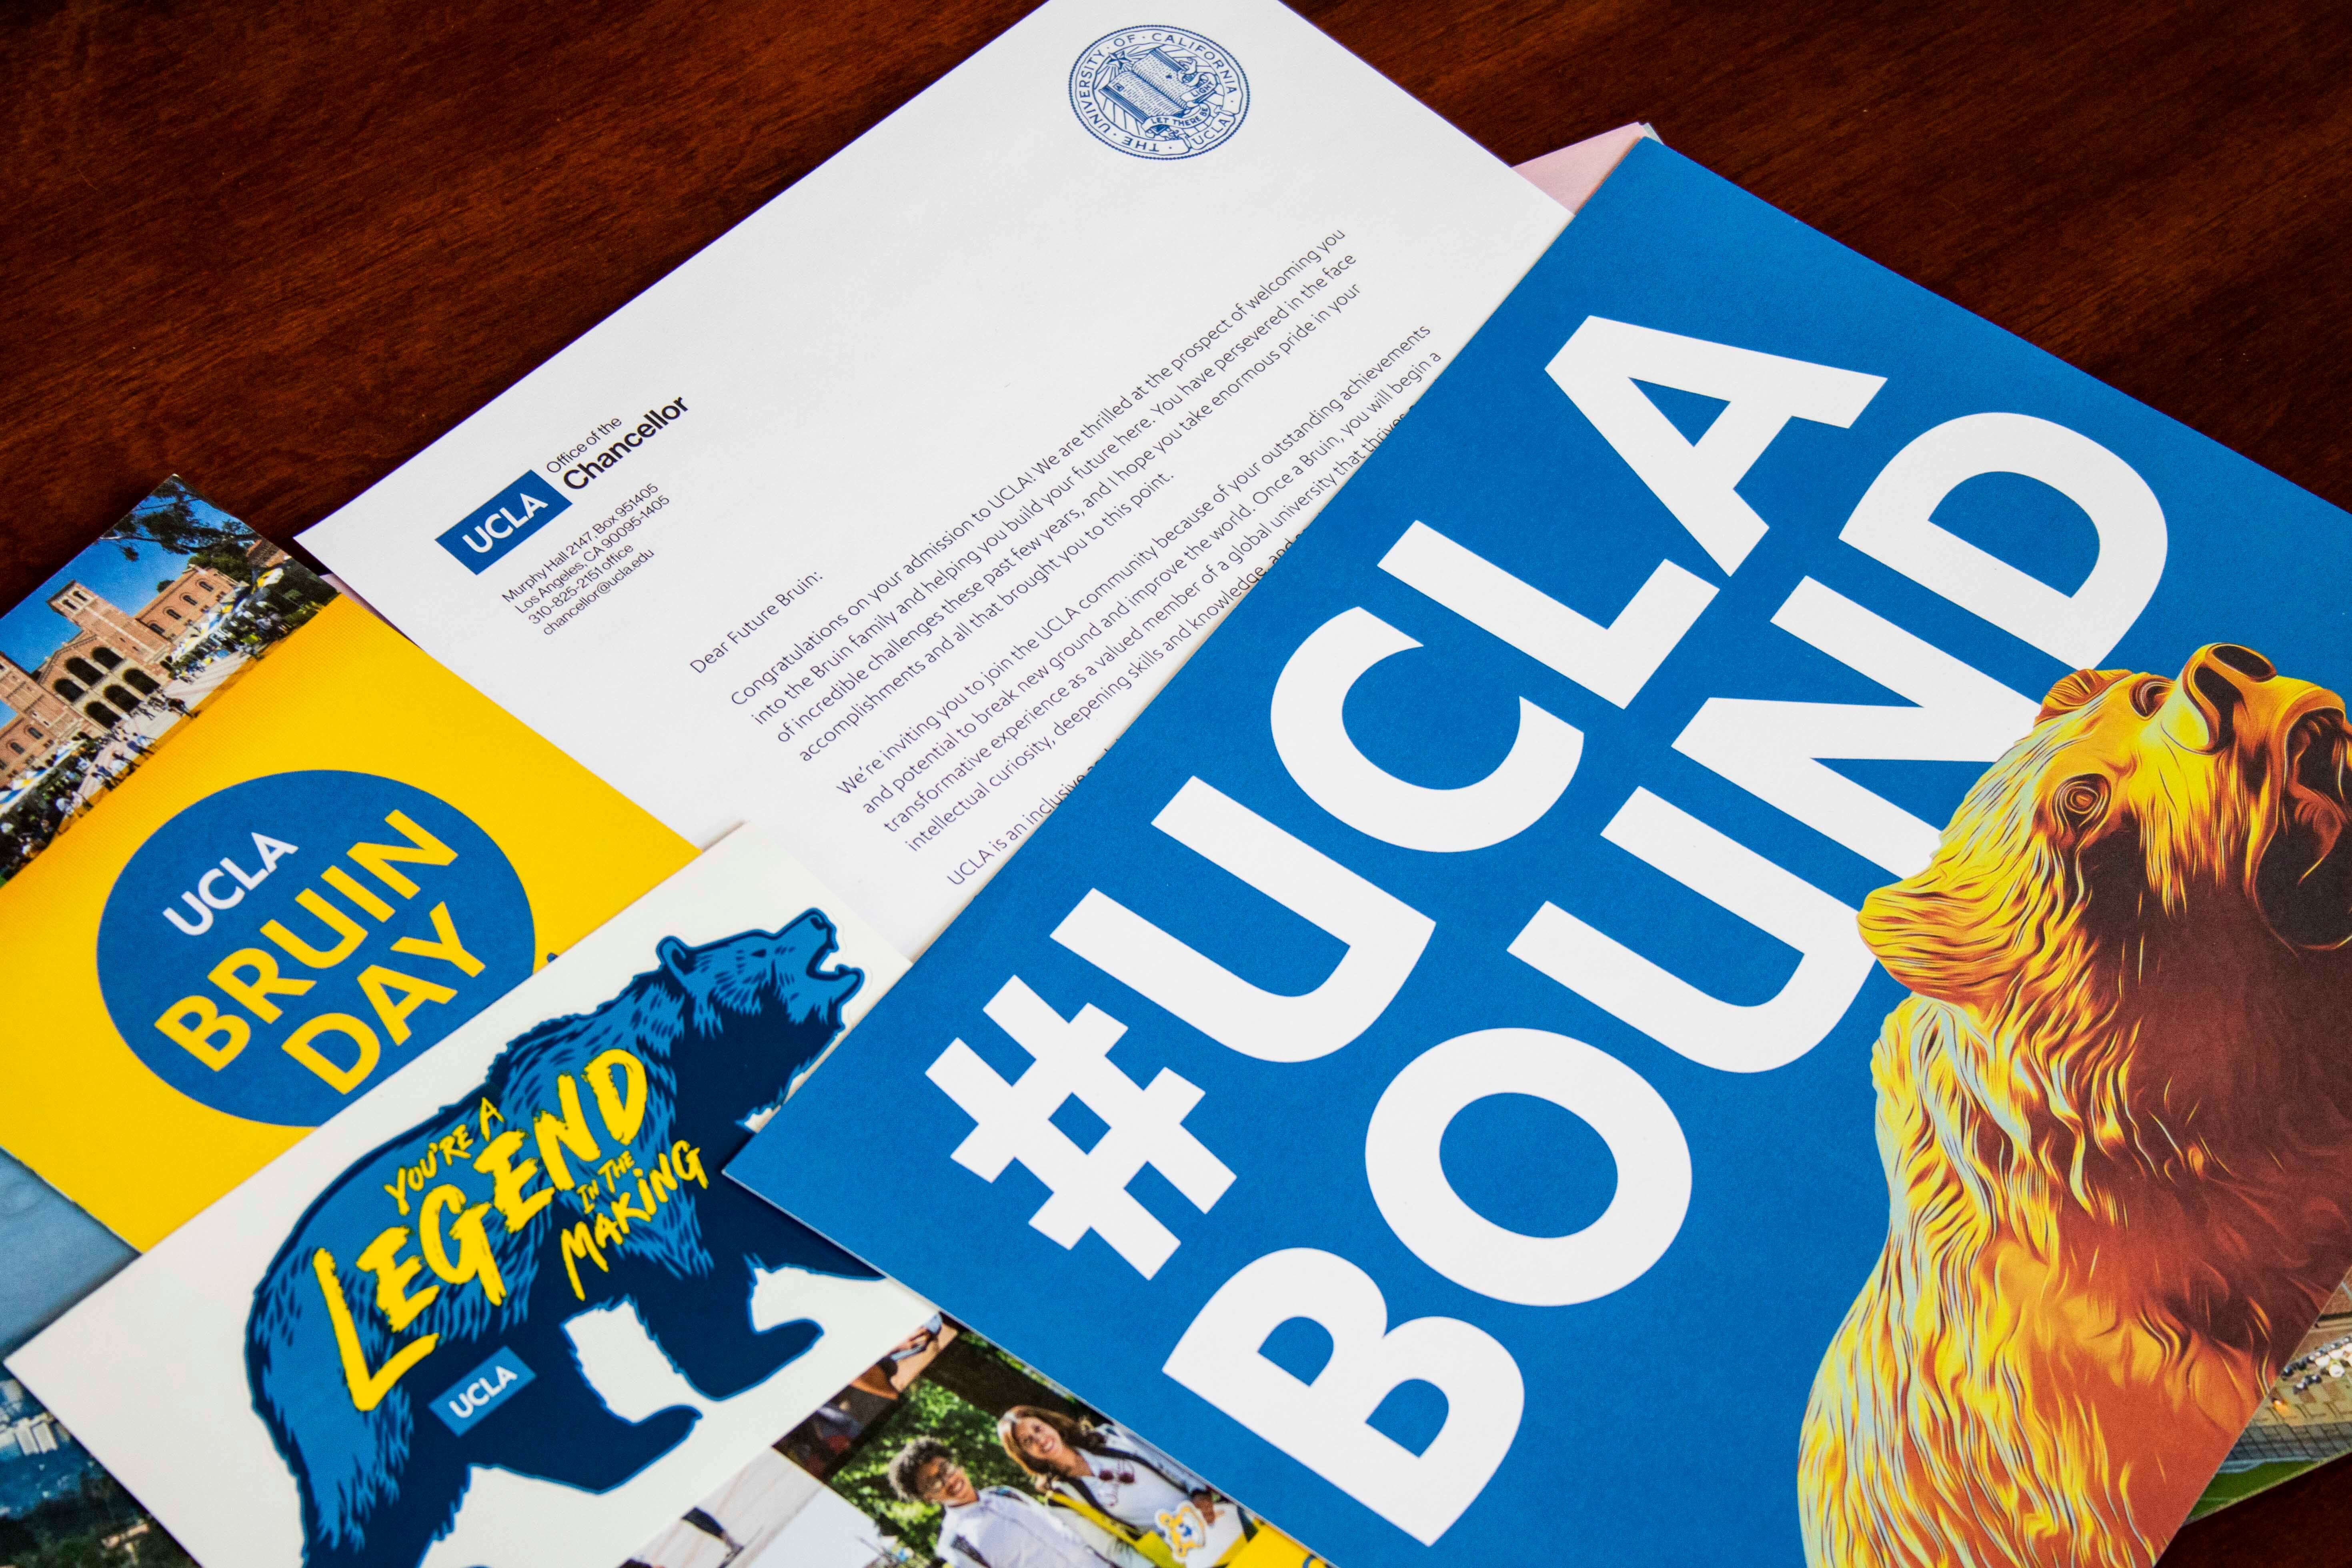
The acceptance packet sent out by UCLA, which includes the acceptance letter, a poster and multiple stickers, is pictured. (Crystal Tompkins/Daily Bruin senior staff)


This post was updated Sept. 22 at 4:11 p.m.
Key Takeaways
- For the fall 2025 quarter, first-year and transfer Asian students made up about 30-45% of UCLA applications, admittances and enrollments from schools in the United States – greater than any other racial or ethnic group for most school types.
- UCLA has seen a rise in overall applicants, with the previous gap between enrolled men and women starting to steadily close as of 2025 admissions as application counts for women plateau and for men rise.
- UCLA’s admitted freshman GPA reached a historic average of 4.23 in 2025, indicating that weighted honors coursework is essential for high school applicants. For transfer applicants, who are evaluated on an unweighted scale, the 2025 admitted average converged around 3.83 across all community college and university pipelines.
For fall 2025, UCLA received the most applications of any UC school. Out of 173,373 applications,145,085 were first-year applicants and 28,288 were transfer applicants. Out of 10,488 enrolled students, 6,553 were first-year students and 3,935 were transfer students.
To examine UCLA’s admission statistics for the 2025-26 academic year, the Stack explored application, admission and enrollment rates at UCLA by gender, race and ethnicity, and grade point average.
Racial and Ethnic Diversity
Hispanic/Latino students made up the largest group of applicants to the UC from California public high schools, comprising 36.52% of the total pool. Asian students from California high schools made up the largest admitted group at 40.27% of all acceptances.
Out of all first-year students from California public schools who enrolled in fall 2025, 38.29% were Asian – almost 10% higher than the proportion of enrolled students who are Hispanic/Latino.
For California private schools, California Community Colleges and out-of-state high schools, the largest proportion of students who applied, were accepted to and enrolled for fall 2025 were Asian. International students made up the majority of the applications, admittances and enrollment from international schools.
Source: University of California. Graphic reporting and interactive by Lillian Wu, Daily Bruin contributor.
The UC has not used affirmative action – the consideration of race, ethnicity or sex in its admissions process – for nearly three decades because of a statewide ban passed by voters.
Peter Hinrichs, an economist who studies education policy, said eliminating affirmative action shifted minority students away from selective UC campuses – notably UC Berkeley and UCLA – and toward less selective ones. Minority students are primarily African American, Hispanic/Latino and Pacific Islander. Advocates for affirmative action in college admissions argue that the practice accounts for an unequal playing field driven by structural discrimination that minority students often face when applying to college.
The UC has seen a systemwide uptick in the proportion and number of students from minority groups who have applied, been admitted to and enrolled at UCLA. From fall 2000 to fall 2025, the percentage of African American students at UCLA has increased from about 3% to 6%. For Hispanic/Latino students, it has gone from about 10% to 20%, while Pacific Islander percentages have remained steady at 1-2%.
The proportion of white students at UCLA has decreased from about 33% to 18%. The proportion of students who are Asian has remained relatively stable over time, ranging between 35-40%.
These students come from across California, the U.S. and the world, with 63% of first-years being from California. The geographic breakdown varies across races and ethnicities.
For California public schools, Hispanic/Latino applicants were spread throughout California, while Asian applicants were primarily from the San Francisco and Los Angeles areas. The trend continues for admitted students and enrolled students, though less prominently for Hispanic/Latino students who were enrolled.
For California private schools, most first-year students who applied, accepted and enrolled for the fall 2025 quarter were located in the San Francisco and LA areas. The number of white students was relatively the same in both areas for all three categories. However, the San Francisco area is predominantly composed of Asian students, and the LA area is predominantly composed of Hispanic/Latino students in all three categories.
Source: University of California. Graphic reporting and interactive by Lillian Wu, Daily Bruin contributor.
Gender Distribution
UCLA has seen a consistent increase in applicants and enrollment over the past 30 years, indicating a growing demand for a UCLA education despite a national decline in college enrollment.
On top of that overall downturn in undergraduate enrollment since 2010, the national proportion of men enrolling in college has decreased. This gap is the most pronounced among Black and Hispanic students.
At UCLA, the gender gap has changed substantially at each stage in the application process.
UCLA has enrolled more women than men since the earliest data available in 1994, and that gap has widened in the last three decades. The gap became considerably larger in 2013, when UCLA enrolled 56.9% women and 43.1% men. However, since 2022, enrollment rates for men have increased slightly. This can be partially attributed to postpandemic enrollment behavior, as while postpandemic enrollment saw a drop overall, a larger decrease in female enrollment in comparison to men at public four-year institutions was seen, with a drop of 2.4% and 1.7% for women and men, respectively, in 2022.
Women are more likely to be accepted to UCLA than men. In 2025, women were admitted at a 12.4% rate versus 10.9% for men. The gap widens further when it comes to enrollment: Women are more likely than men to enroll at UCLA, at a rate of 55% versus 51.5%.
This trend, though, changes based on the residency of the applicants. More women than men applied in the domestic pool at a split of 1.14 to 1, respectively. However, this trend flips with international institutions: About 50.5% of applicants were male while 45% were female in 2025.
Source: University of California. Graphic reporting and interactive by Vidusha Adira, Daily Bruin contributor.
Source: University of California. Graphic reporting and interactive by Vidusha Adira, Daily Bruin contributor.
GPA Statistics
As GPAs continue to rise, the standard to earn a spot at UCLA has reached historic heights.
In recent years, Advanced Placement courses have seen a steady surge in national popularity. Data from the College Board shows the percentage of public high school graduates taking AP exams rose from 34.3% in 2015 to 37.0% in 2025. Alongside the growth of AP enrollment, high school coursework became even more important after 2020, when the UC system suspended SAT and ACT requirements and subsequently adopted a fully test-blind admissions policy.
Student demand for UCLA, too, remains as high as ever. UCLA has been one of the most applied-to schools in the country since 2012. It was ranked as the No. 2 public school in the nation in the 2026 U.S. News & World Report ranking and tied with Rice University and Vanderbilt University for No. 17 overall.
Source: University of California. Graphic reporting and interactive by Bethany Kim, Daily Bruin staff.
For California public high schools, the average GPA of UCLA applicants stood at 3.89. However, the bar to secure admission was much higher: Admitted students had an average GPA of 4.24. California private schools mirrored this trend. Although they had a slightly higher applicant average GPA of 3.98, admitted students averaged a 4.23 GPA.
Out-of-state high school applicants for UCLA brought the highest self-reported applicant GPAs at 4.05. International high school applicants also had slightly higher GPAs than in-state students, applying with a 3.94 average. Despite this, both out-of-state and international admitted students had similar GPAs as in-state admitted students, at 4.21 and 4.20, respectively.
Across all of these groups, UCLA’s overall admitted average of 4.23 significantly outperformed the broader UC systemwide average of 3.98.
Source: University of California. Graphic reporting and interactive by Bethany Kim, Daily Bruin staff.
The hypercompetitive race to earn a spot at UCLA – which boasts an acceptance rate of 9% – reflects a structural shift that has taken place over the past three decades.
In 1995, the average freshman applicant to UCLA had an average GPA of 3.68, and an admitted student had a 3.94. By 2025, UCLA’s average applicant GPA rose to 3.97, while the admitted average climbed to 4.23. Across the broader UC system, applicant averages rose from 3.63 in 1995 to 3.91 in 2025. At the same time, though, high school grade inflation has skyrocketed over the past three decades: The average high school GPA in 1985 was a 2.6, while the average high school GPA in 2021 was a 3.1 – a 19.2% increase.
Source: University of California. Graphic reporting and interactive by Bethany Kim, Daily Bruin staff.
In the transfer applicant pool – in which GPAs reflect standard college grading scales rather than weighted high school courseloads – academic thresholds remain more uniform across higher education pipelines. For UCLA, California Community College transfers applied with an average 3.52 GPA, California State University transfers applied with an average 3.48 GPA and UC transfers applied with an average 3.57 GPA. California Community College transfers were admitted with an average 3.83 GPA, California State University transfers applied with an average 3.82 GPA and UC transfers were admitted with an average 3.82 GPA.
However, that 3.8 threshold comes after an even steeper 30-year rise in grade-point averages than in freshman admissions. In 1995, the average admitted UCLA transfer student held a 3.47 GPA. By 2025, that figure had surged to 3.83.
To ensure equity across vastly different learning environments, UC admissions reviewers examine academic achievement within the specific setting of a student’s high school. Admissions officers recognize some schools lack extensive course offerings, while others offer a rich array of AP, IB and community college dual-enrollment options, according to the UC’s website.
Among California high schools sending students to UCLA, average admitted GPAs ranged from a low of 3.86 at Orange Lutheran High School in Orange to a high of 4.38 at Odyssey STEM Academy in Lakewood. On a county level, Monterey had the lowest average admitted GPA of 3.96, while Butte had the highest average admitted GPA of 4.32.
About the Data
Schools with no applicants are not shown. The numbers of applicants for any category with fewer than five students are not shown. The numbers of admits and enrollees for any category with fewer than three students are not shown. When all applicants, admits or enrollees belong to a single category, that category is redacted.
Data is filtered by UCLA from https://www.universityofcalifornia.edu/about-uc/information-center/admissions-source-school.
For freshmen: Average GPA is calculated based on high school GPA of students from the same school. GPAs used for this analysis are weighted, capped high school GPAs for 10th and 11th grade college preparatory courses where extra points up to eight semesters, no more than four in the 10th grade, are added to the GPA. See https://admission.universityofcalifornia.edu/admission-requirements/freshman-requirements/gpa-requirement.html.
For transfers: Average GPA is calculated based on transfer GPA for students from the same college. GPAs are for all courses transferable to UC. See https://admission.universityofcalifornia.edu/admission-requirements/transfer-requirements/preparing-to-transfer/transfer-gpa.html.