

How UCLA’s landscape shapes summer heat
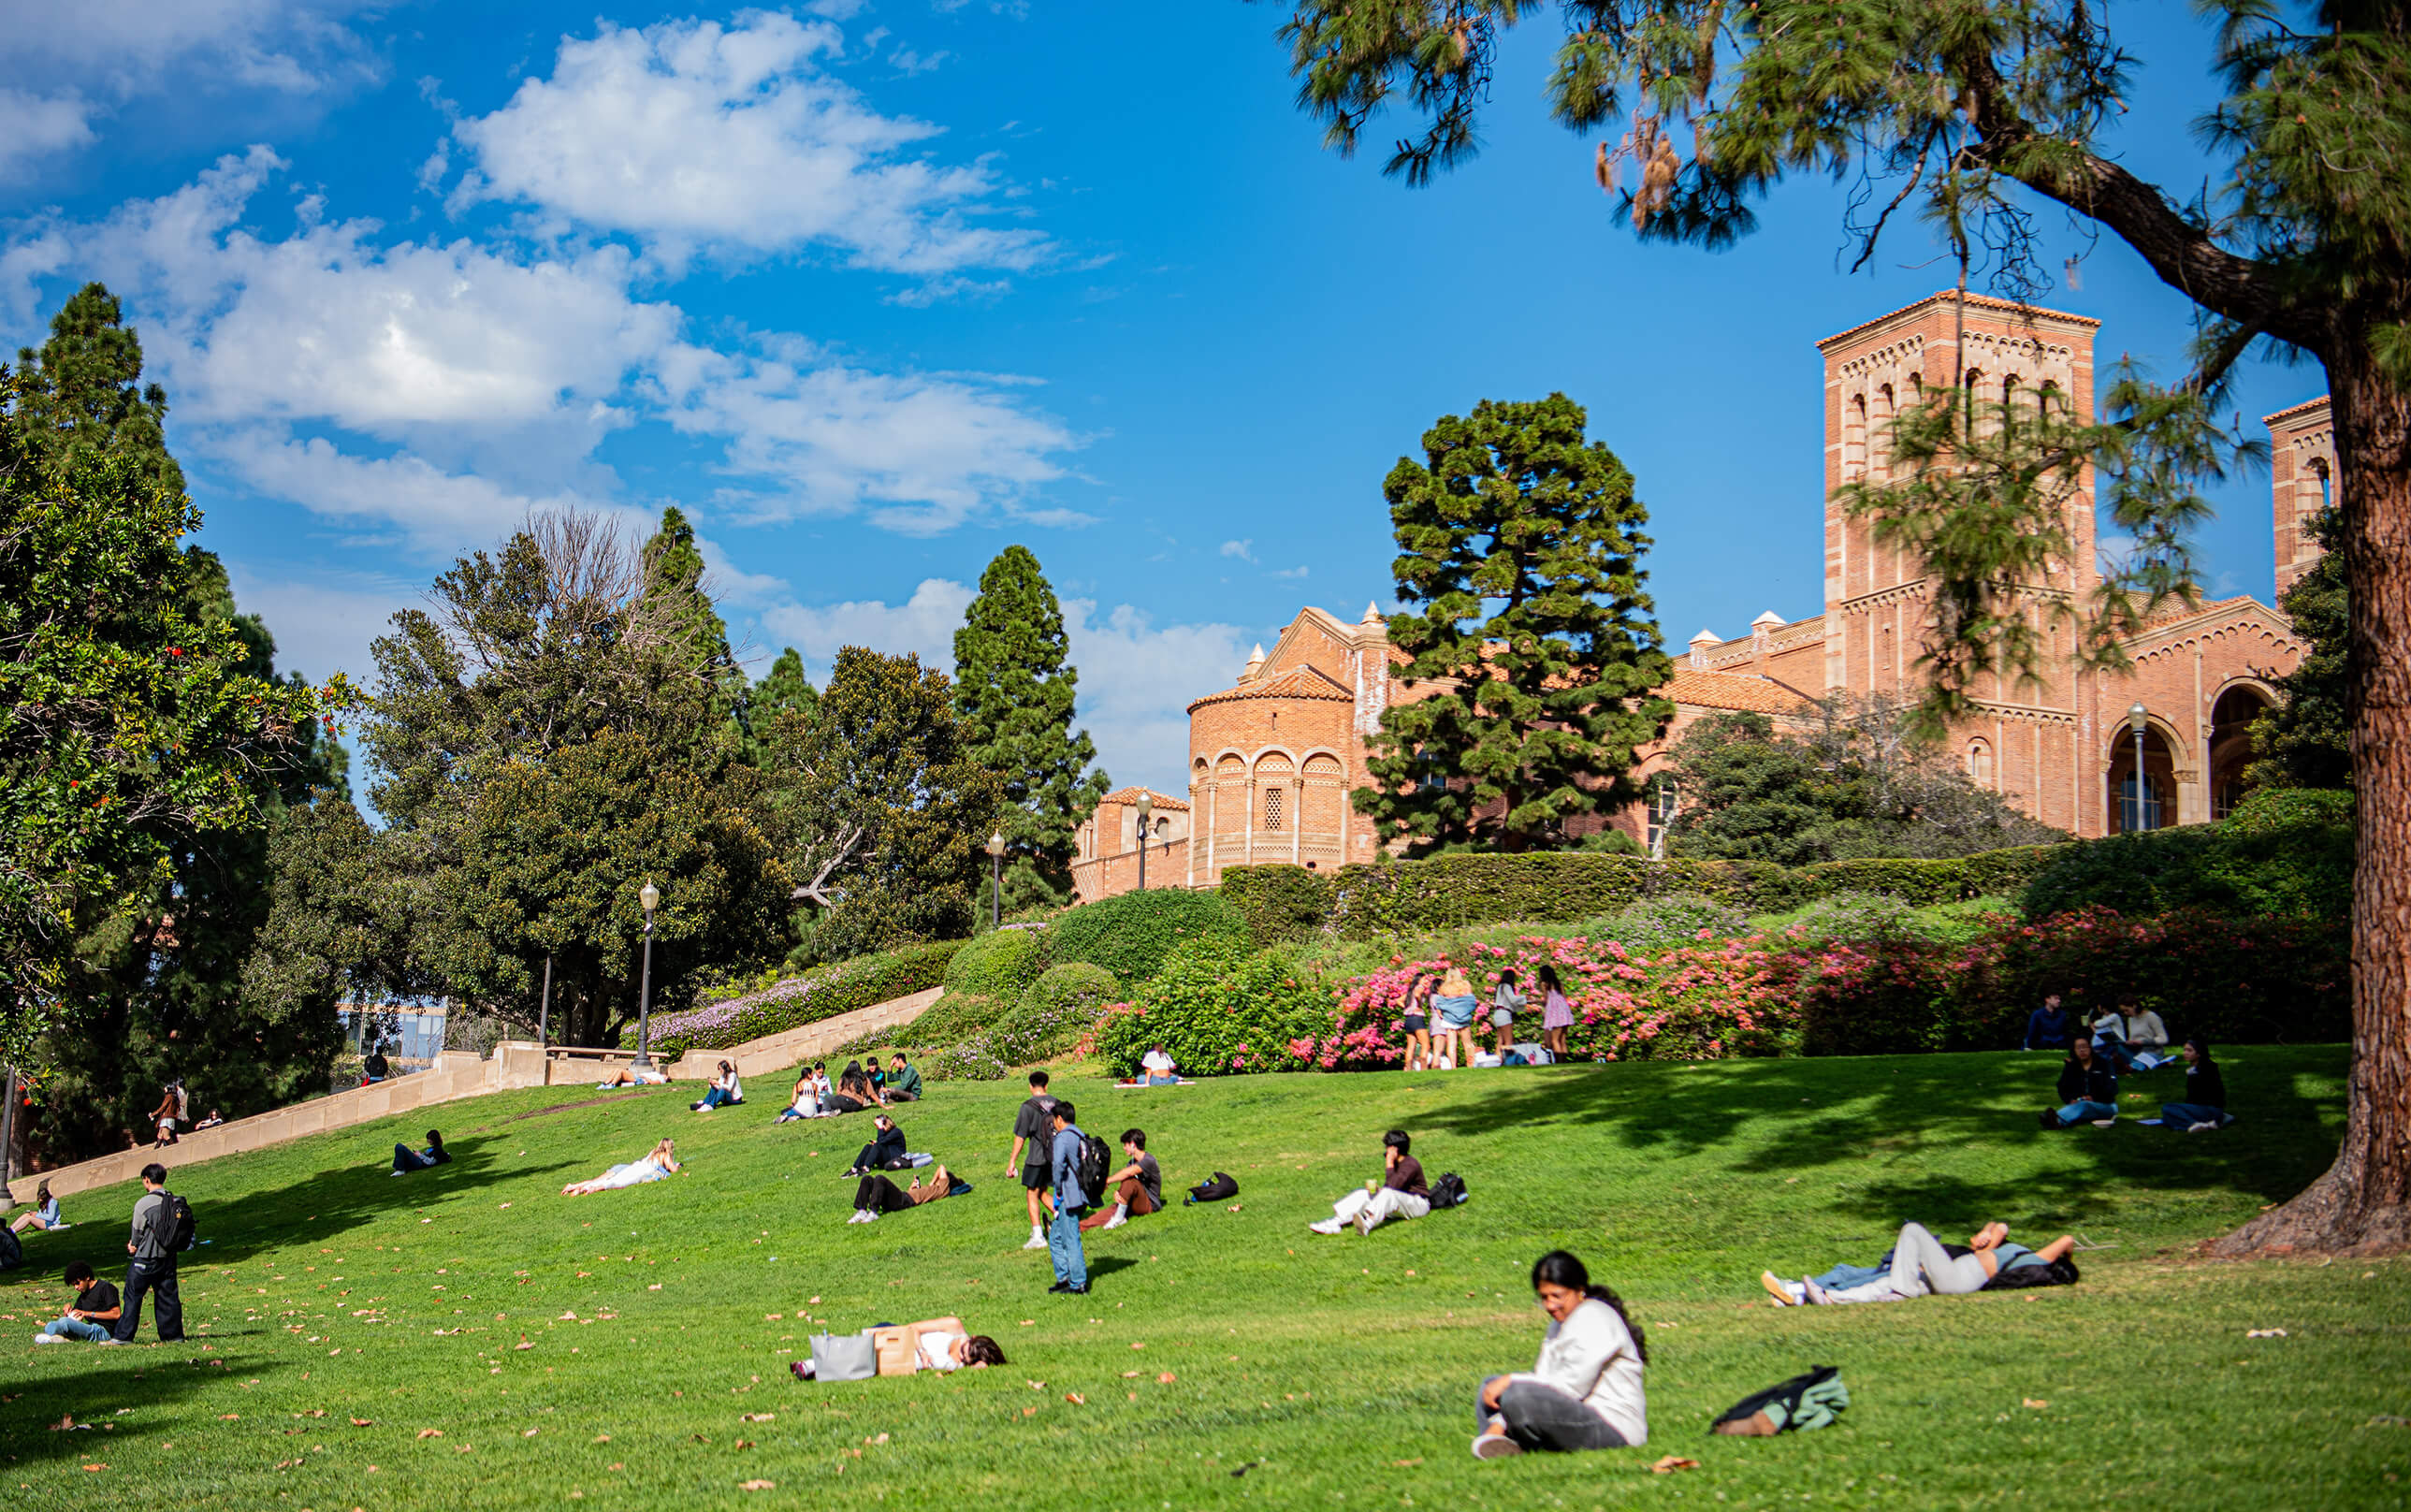
Students gather on the lawns near Royce Hall. Satellite imagery analyzed by The Stack shows that vegetation and development shape where summer heat builds up across campus. (Amelia Chief/Daily Bruin senior staff)


This post was updated Aug. 19 at 4:30 p.m.
The National Weather service put Los Angeles County on extreme heat watch July 14, with temperatures in certain areas expected to exceed 100 degrees throughout the week. Residents were urged to seek shade, stay hydrated and take advantage of cooling centers across the county.
With heat advisories becoming increasingly frequent in California, state and local governments are finding ways to combat the extreme heat, including by expanding cooling infrastructure, increasing tree canopies and preparing communities for hotter summers.
California’s universities are looking to do the same.
Thousands of students spend hours each day walking across their college campuses. The designs of these spaces can impact how students experience the heat, especially during summer classes and the start of the school year.
To understand how campus landscapes influence summer temperatures, The Stack at the Daily Bruin analyzed summer 2025 Landsat satellite images, which measured land-surface temperature and vegetation across all nine undergraduate UC campuses. The analysis also examined historical satellite images and UCLA Housing data to understand how campus development and housing infrastructure can impact students’ experiences with summer heat.
UCLA falls in the middle of a much hotter UC system.
Not every UC campus experiences summer heat equally.
Inland campuses generally recorded warmer land-surface temperatures than coastal campuses. Campuses surrounded by forests or situated by the Pacific Ocean remained substantially cooler.
UC Riverside – located 54.8 miles inland – recorded the hottest average land-surface temperature among the nine undergraduate campuses at approximately 122 degrees Fahrenheit. Meanwhile, UC Santa Cruz – which is 2.6 miles from the coast – ranked as the coolest, averaging roughly 84.7 degrees while also having the highest amount of vegetation. UCLA – located 5.7 miles from the coast – ranked fourth overall with an average surface temperature of approximately 103.2 degrees, placing it between California’s cooler coastal campuses and hotter inland universities.
Although UCLA’s proximity to the ocean helps keep it cool, its setting in a densely populated, urban area and extensive built environment contribute to its middle-of-the-pack ranking.
Source: U.S. Geological Survey. Graphic reporting and interactive by Madison Jones, Daily Bruin contributor.
At UCLA, a walk across campus can mean walking through different heat conditions.
While UCLA ranked near the middle of the UC system overall in terms of heat, temperatures varied considerably within the campus.
Average summer land-surface temperatures ranged between roughly 94 to 114 degrees depending on the campus location. Large paved plazas and dense building clusters were consistently warmer than tree-lined walkways and landscaped open spaces. Among the warmest areas identified were the paved spaces surrounding Bruin Walk and Pauley Pavilion, while heavily vegetated portions of campus remained comparatively cooler.
Those differences mean that students can – at least partially – beat the heat by choosing a shadier route to class. For student athletes, though, time spent in the warmest parts of campus often isn’t an option.
For Ander Marticorena, a second-year statistics and data science student and midfielder on UCLA’s men’s soccer team, training continues regardless of the weather. Coaches regularly emphasize the importance of hydration and electrolyte replacement, he added.
“It’s way harder to practice and to play when it’s hot,” Marticorena said. “It’s more difficult to breathe. You get tired more easily.”
Athletes in other outdoor sports described similar challenges. Although swimmers practice in the water, Olympic swimmer and UCLA alumnus Beril Böcekler said they often don’t realize how much fluid they’re losing.
“We sweat most of the time during our practice, but nobody realizes because we’re in the water,” Böcekler said.
UCLA’s landscape has changed dramatically over the past four decades.
Today’s campus looks very different from the UCLA of the 1980s.
Satellite imagery from 1985-2025 shows UCLA steadily expanding its academic and residential footprint. Surface parking lots and open land have gradually given way to residence halls, academic buildings and pedestrian infrastructure. Most recently, the 2022 addition of the Olympic and Centennial residence halls contributed to the university’s trend of denser developments.
While that growth has helped UCLA expand its academic spaces and house more students, it has also increased the amount of paved and built surfaces across portions of campus. Today’s hottest areas tend to coincide with denser development, while pockets of mature vegetation remain noticeably cooler.
Source: Google Earth historical imagery from U.S. Geological Survey. Graphic reporting and interactive by Madison Jones, Daily Bruin contributor.
Housing adds another layer to students’ experience of summer heat.
While UCLA’s original classic residence halls were built between 1959-64, before central air conditioning was common in campus housing, many of the university’s newer residence halls include central air conditioning.
That difference stood out to Marticorena after moving to LA from northern Spain, where air conditioning is relatively uncommon.
“For some people (in Spain), it’s not worth to have the AC because you only use it for two months,” he said.
Source: UCLA Housing. Graphic reporting and interactive by Lillian Wu, Daily Bruin contributor.
Source: UCLA Housing. Graphic reporting and interactive by Lillian Wu, Daily Bruin contributor.
Housing data from September 2025 shows that roughly 70% of UCLA’s available housing capacity offers air conditioning, meaning most students now have access to cooled living spaces. Of UCLA’s available housing capacity, about half is dormitory space with air conditioning, 27% of university apartments with air conditioning, 22% of dormitory space without air conditioning and 3% of university apartment space without air conditioning. Among residence halls, where most first-year students live, 64% of available space is in buildings with air conditioning, while 36% is in buildings without it.
A warmer future is ahead.
Compared with many inland UC campuses, UCLA’s temperature remains relatively moderate during the summer.
Yet The Stack’s analysis shows that heat is far from evenly distributed across campus. Small changes in vegetation, pavement and building density create noticeable differences in land-surface temperatures, even over short distances.
Those differences may become increasingly important as the LA region continues to warm. By the late 21st century, average maximum temperatures are projected to increase by five to eight degrees Fahrenheit, while the hottest day of the year could be up to 10 degrees warmer than it is today.
As California prepares for hotter summers, adaptation is becoming part of daily life on campus.
When Marticorena first arrived from Spain, one habit immediately stood out.
“Everybody’s drinking water all the time,” he said.
Carrying a water bottle may seem like a small adjustment, but it reflects a broader reality: UCLA – and other UC campuses – are getting hotter.
About the data
The Stack analyzed cloud-free Landsat 9 satellite imagery collected in June and July 2025 to estimate land-surface temperatures and vegetation across all nine undergraduate UC campuses. Multiple satellite scenes were processed for each campus, and the resulting land-surface temperature and vegetation measurements were averaged to produce a single representative estimate for each campus. Land-surface temperature measures the temperature of the Earth’s surface observed by satellite and should not be interpreted as ambient air temperature. Historical satellite imagery was used to examine changes in UCLA’s built environment over time. Housing and occupancy information was requested from UCLA Housing.