


Throwback Thursday: Prediction errors persist from 1980 to 2016, what pollsters changed for 2020
(Daily Bruin archive)

By Isabella Klesmith
Nov. 3, 2020 5:14 p.m.
If the major news outlets had been correct in their predictions for 2016, Hillary Clinton would be President.
Today, The Quad is taking a look through the archives to see why many polls failed to predict the winners of the 1980 and 2016 United States presidential elections, and how pollsters in 2020 have changed their methods accordingly.
Election forecasters in 2016 projected that Clinton had a 70% to 99% chance of winning the election.
According to the New York Times, the most likely outcome left Clinton with 322 electoral votes – far exceeding the necessary 270 to be president. This prediction was far off from the 232 electoral votes Clinton actually ended up receiving.
As such, President Donald Trump’s Election Day victory left many Bruins shocked.
“Everything was indicating that she was going to be up,” one student told the Daily Bruin in 2016. “Even exit polls earlier today showed that she should be up, and then everything started falling apart.”
As students protested in the wake of his election, many wondered: How did the polls get it so wrong?
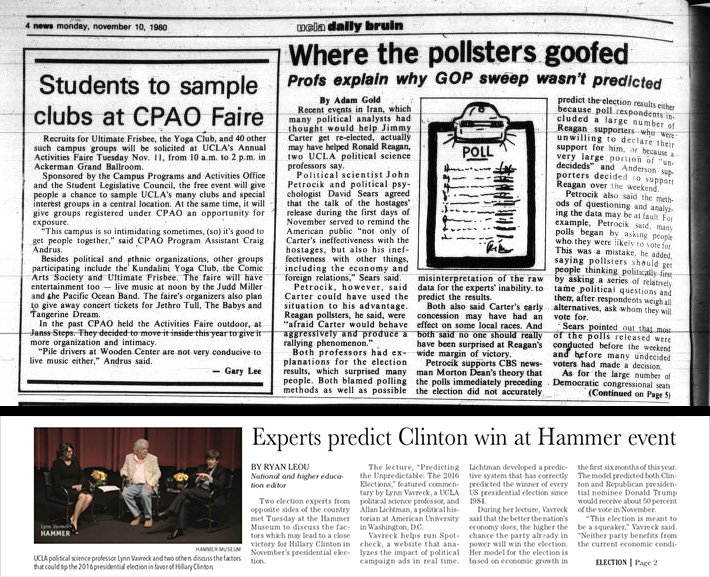
A 1980 Daily Bruin article sought to answer the same question following the 1980 presidential election. Despite being eight points behind former President Jimmy Carter in a Gallup poll of registered voters taken about a week before the election, former President Ronald Reagan won by an astounding 10 points, claiming all but six states and Washington D.C.
Speaking to The Bruin in that article, UCLA professors attempted to explain “Where the pollsters goofed.”
“The polls immediately preceding the election did not accurately predict the election results either because poll respondents included a large number of Reagan supporters who were unwilling to declare their support for him, or because a very large portion of ‘undecideds’ and Anderson supporters decided to support Reagan over the weekend,” the article said.
According to Gallup, the presidential debate held one week before Election Day may have convinced many to vote for Reagan. The ongoing Iran hostage crisis – which occurred under Carter’s administration – also likely shifted public opinion in Reagan’s favor.
Some pundits similarly argue that undecided voters, as well as those that may have been embarrassed to share their preference for Trump with pollsters, disrupted the polls in 2016. This “shy Trumper” theory has been largely disproven by the fact that Trump did not perform significantly better in online polls, where voters would not have had to reveal their views to real people.
However, the large proportion of undecided voters in 2016 likely skewed the polls as they were thought to have done in 1980.
According to a New York Times article, about 20% of voters supported a third-party candidate or were still undecided six months before Election Day in 2016. These undecided voters make it difficult for pollsters to accurately assess public opinion.
In the four years since the 2016 election, Pew Research Center researchers have examined the polling methods that resulted in erroneous predictions in 2016. These researchers have determined that nonresponse bias, which occurs when certain groups within a population tend to not respond to polls, and incorrect assumptions about who would turn up to vote are largely to blame.
Many pollsters relied on data from past elections to predict who would vote in 2016. However, significant changes in voter demographics invalidated many of these assumptions, resulting in inaccurate polls. Notably, nonwhite voters did not turnout for Clinton at the same rates as they did for former President Barack Obama in 2012.
Many pollsters also failed to account for the influx of less educated voters in 2016, who were more likely to vote for Trump.
Nonresponse bias only exacerbated incorrect assumptions about voter turnout. Studies found that voters who typically align with Trump, including registered Republicans, less educated and anti-establishment voters, were less likely to respond to polls. This nonresponse bias resulted in polls that did not sufficiently represent these groups and overemphasized Clinton’s support.
Although pollsters can never know exactly who will vote on Election Day, adjusting their samples to account for the changes in voter composition we saw in 2016 can give us a better idea of what we might be able to expect in this election.
More polls, including the New York Times and Siena College surveys, are weighting by education and turnout to account for populations that may be underrepresented as a result of nonresponse bias.
Some of the most recent polls show Democratic candidate Joe Biden ahead of Trump in most states, including key swing states such as Wisconsin, Pennsylvania, Arizona and Florida. Early ballot counts also indicate that 2020 will witness historic levels of voter turnout, unlike the 20-year low seen in 2016.
No matter what the polls say, students will eagerly watch as the next president of the United States is elected, just like past Bruins of 1980 and 2016.
If we learn nothing else from these elections, we learn that regardless of any polls or predictions, it’s not over until it’s over.

