Are All General Education Courses Created Equal?: Exploring GE Grade Distributions
(Helen Yuan/Daily Bruin)


The likelihood of earning an A or higher in a GE course can vary by more than 20% depending on the requirement it fulfills.
With more than 400 general education courses across 97 departments to choose from – and with anywhere from 7-100% of students earning As or better in each one – UCLA students have lots to consider when selecting their next GE. The Stack explored some of the factors, such as class size and grade distribution, that come into play as undergraduate students select their GEs.
How GEs are Approved
Before a course can become a GE, it undergoes an approval process with the General Education Governance Committee, said Torquil Duthie, a professor of Asian Languages and Cultures and chair of the GEGC.
The chair said the committee reviews GE proposals, which include a syllabus outlining course requirements. The governance committee is split into three groups, and each is responsible for one of the three major foundation areas: arts and humanities, society and culture, and scientific inquiry. Within each group, members discuss a proposed GE’s suitability for that foundation.
“I think GEs do a good job of allowing you to shift your focus on how you approach the world and how it became what it is today,” said Spencer Bergland, a second-year microbiology, immunology and molecular genetics student.
Duthie said around six to eight new GEs are added each quarter, with most falling under arts and humanities or society and culture. In addition to reviewing new GEs proposed by faculty, the committee also periodically revises existing GEs to ensure they are not outdated and still meet basic requirements. The committee also assesses potential GEs’ workload, such as the amount of reading assigned, to ensure that GEs remain accessible and engaging for students from various disciplines.
“It was interesting learning about the structure of American government while we were going through such an important national election,” said Everest Cheng, a third-year biochemistry student who previously took Pol Sci 40, Introduction to American Politics, around the 2024 presidential election. “GEs are a way for me to relax.”
Each year, Duthie teaches a GE on Japanese civilization, Japan 50. He said he encourages students to choose courses that interest them in terms of subject matter – even if they appear challenging – because the quarter system allows them to try different courses without committing for very long.
“What I hope a student gets out of a GE is having their eyes opened about something they didn’t know and that they take an interest in,” Duthie said.
Grade Distributions and Class Sizes by Requirement
To compare the difficulty and total enrollment of GE courses across categories, the Stack visualized GE courses by the total number of students enrolled since fall 2021, including summer quarters, and the percentage of students who earned grades at A or better in the same period.
The Stack denoted a class as “large” if the average number of students enrolled during each quarter the class was offered was higher than the median 89 students and vice versa for “small class.” Similarly, classes with an overall A percentage above the median (61.5% A or A+) were marked as “relatively easy.”
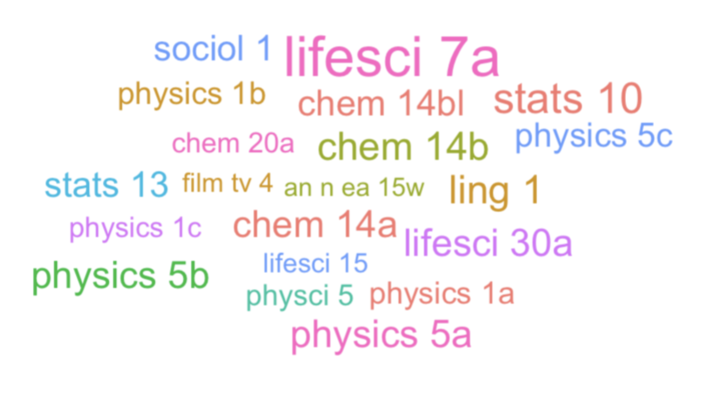
Seventeen out of the 20 most enrolled-in courses – including LifeSci 7A and Stats 10 – fulfill either the life science or physical science requirement. However, the scientific inquiry foundation offers the smallest number of unique courses out of the three foundations, at 118 courses.
In contrast, 256 courses fulfill the society and culture foundation, and 303 courses are under the arts and humanities foundation. Duthie said this is partially because courses must satisfy extensive requirements to be approved as a science GE.
Average Grades by Category
Visual and performance arts courses award the highest average percent of grades at A or A+ at about 71%, making it the most generous category. Other humanities categories are clustered around an average of 55%-67% of A or A+ grades.
In contrast, both life and physical sciences have the lowest average percentage of A or A+ grades. The percentages for life sciences and physical sciences are about 57% percent and 47%, respectively. Science GE courses have lower A grades rates than other categories, suggesting higher levels of difficulty.
The lower percentages in science GEs reflect more than subject difficulty. Many of the courses under this category are also pre-major requirements for majors in the sciences. This includes the Chemistry 14 and 20 series, Physics 1 and 5 series, and LifeSci 7A and 30A courses which serve as an introduction for science majors.
The wide margin between categories highlights the importance of course selection for a student’s GPA. However, averages only show a glimpse of the distribution.
Variation Within Categories
The charts above show how the grading distribution of individual courses can vary widely within each category.
Across most humanities, courses tend to cluster in the higher ranges of percentage of students receiving an A or A+ grade. In these categories, most courses fall above the 50% mark and are concentrated around 60%-80%. Lower ranges of As are infrequent, showing that most humanities GE courses award a relatively high number of As to their students.
The philosophical and linguistic analysis category does not follow this same pattern. Unlike other humanities, most grades at A or A+ are concentrated around 50%-60%, with a low amount of courses on both the high and low ends. This aligns with the category’s overall average of 57%, the lowest among the humanities.
The science categories show a different distribution. Life sciences tend to cluster in the center at 50%-60%. Some courses also have percentages of grades at A or A+ that stand at the higher end, between 60%-90%.
Physical sciences display the widest range among the categories. There is no distinct peak, with courses ranging in the percentage of A or A+ grades awarded. Unlike other categories that cluster around similar percentages, physical sciences have a more even mix of low, middle and high A rates. Because most courses fall between 30%-50%, the category’s overall average percentage of grades at A or A+ is lower than other areas. This variation makes grades in the physical sciences less predictable for students.
Course Catalog
Students can use the following course catalog to search for specific classes. The table can be filtered by GE category, Writing II, and Laboratory/Demonstration credit to explore offerings in each requirement.
About the Data
The Stack analyzed grade data consolidated from public records requests covering fall 2021 to spring 2025.