


Data analysis competition Datafest combines statistics with speed
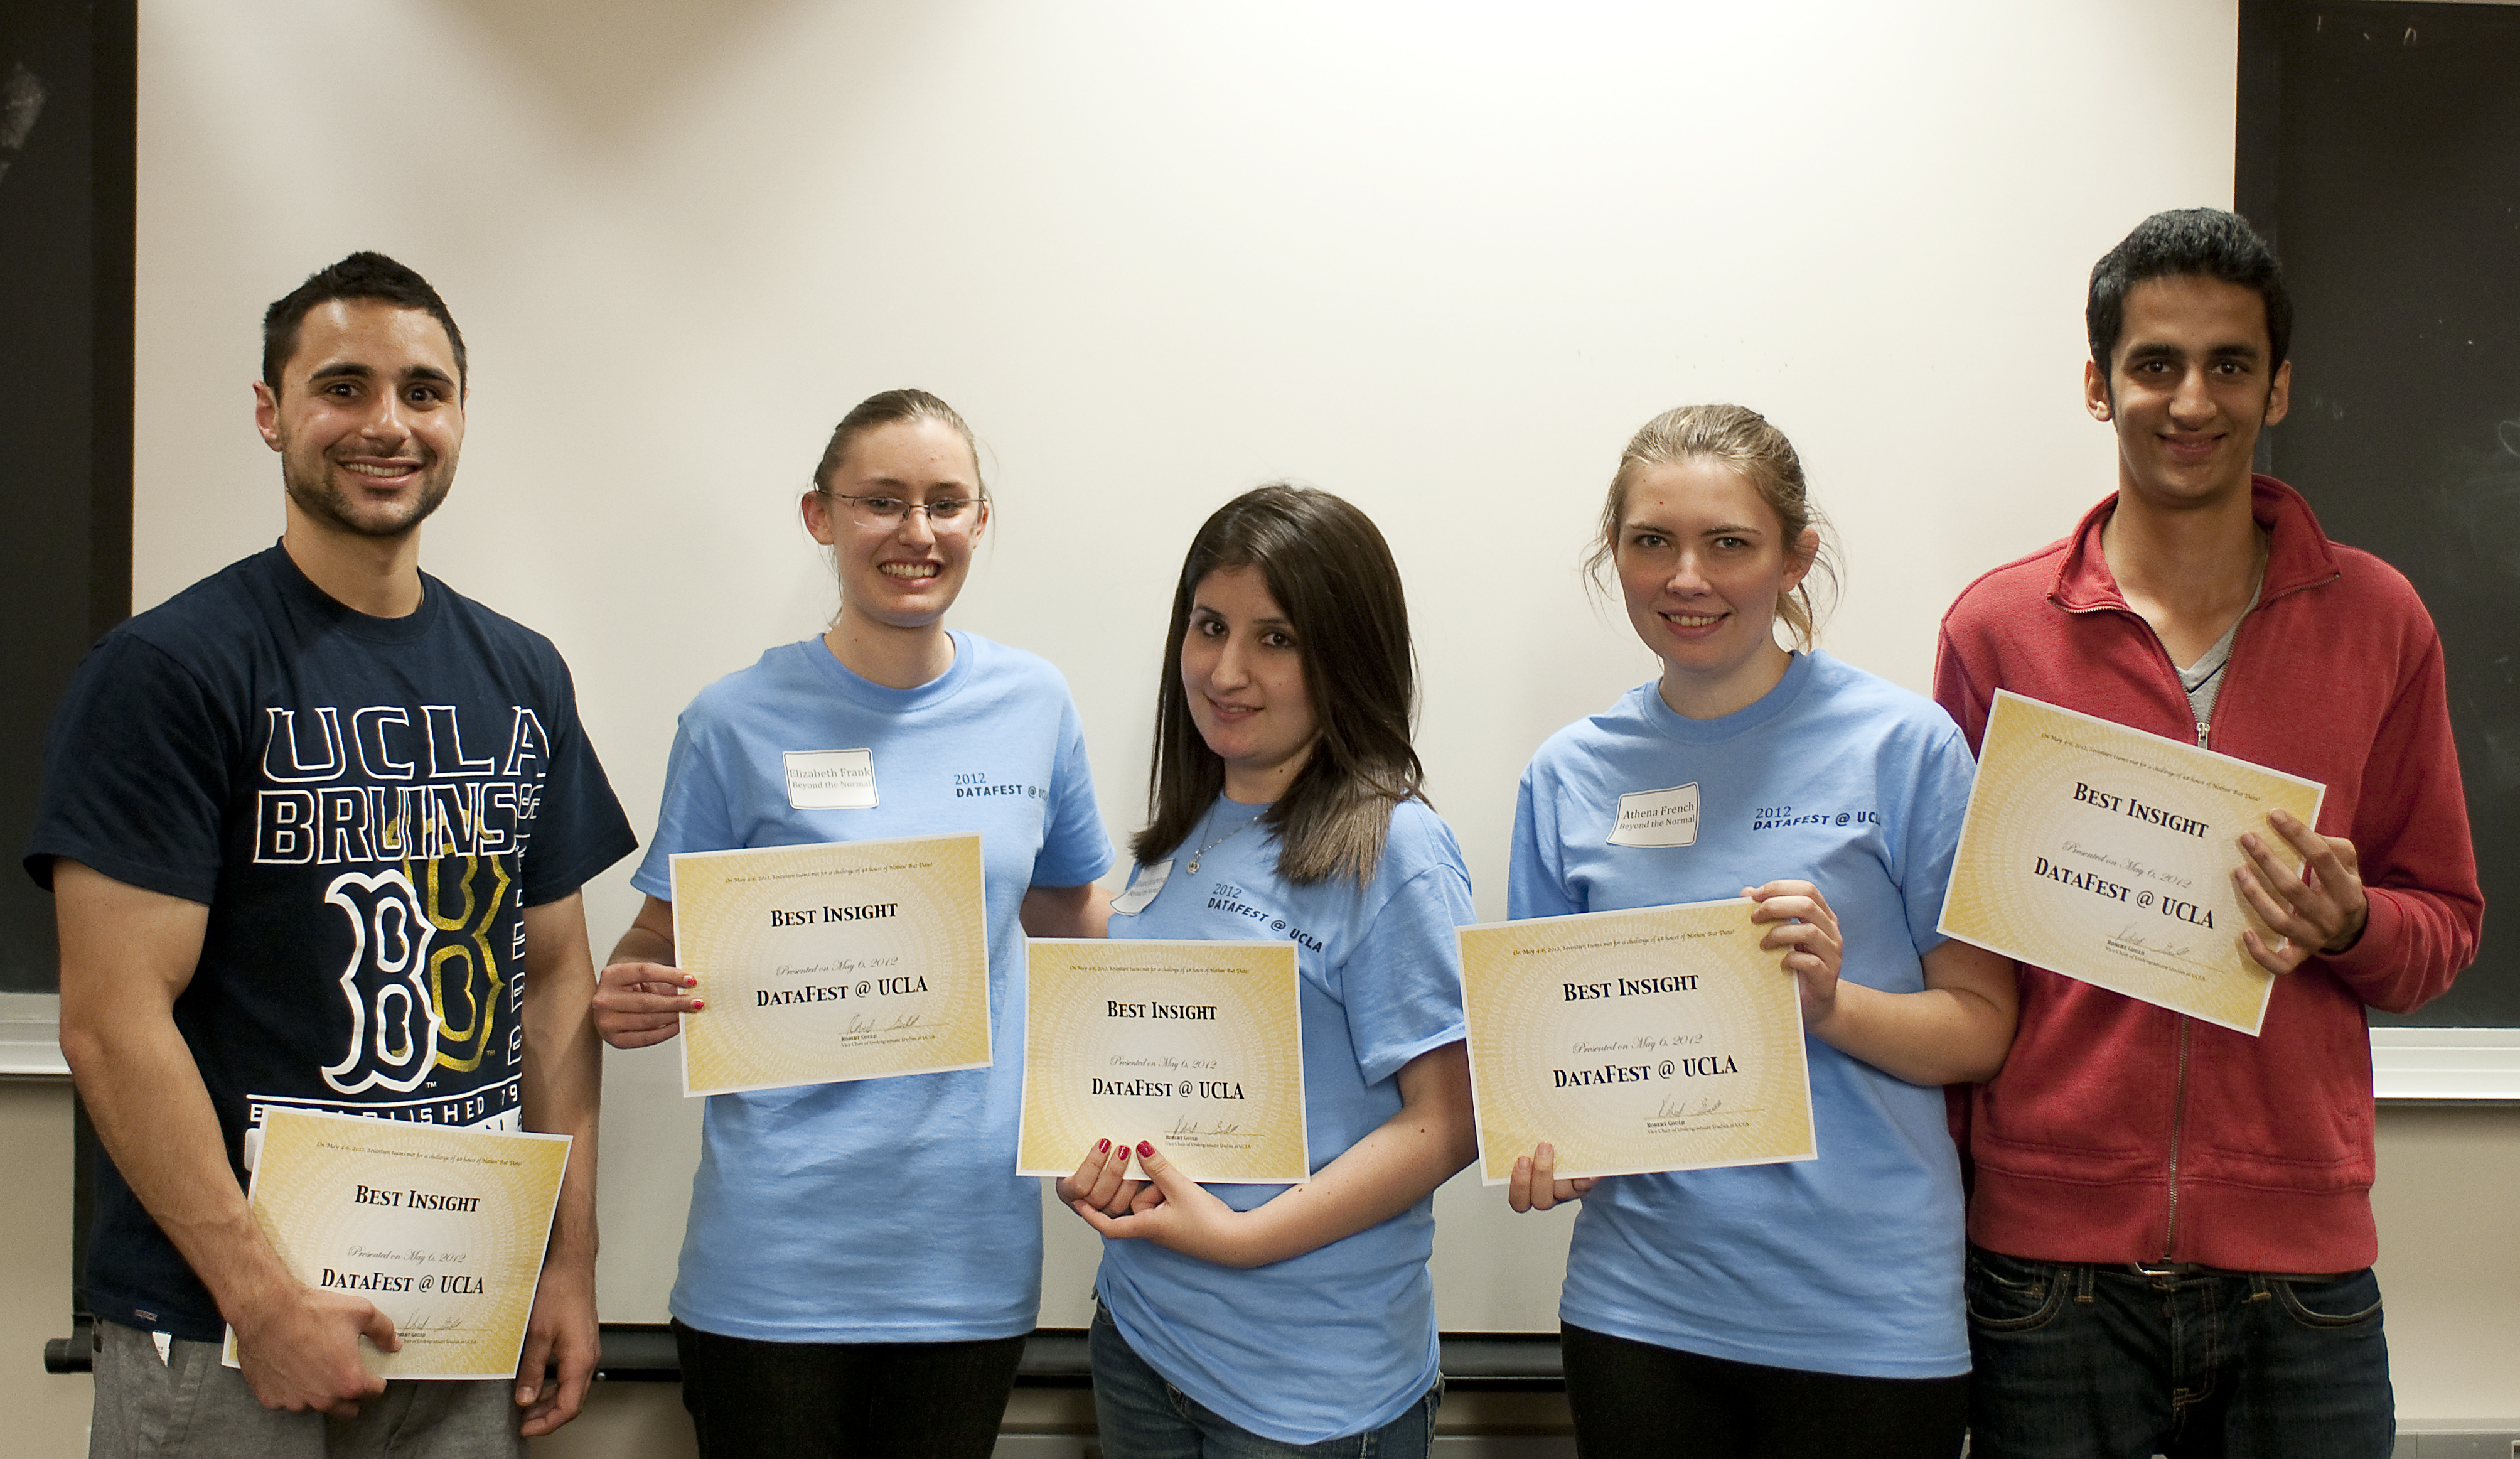
Students participated in the Datafest competition, put on by the UCLA Statistics department, this weekend.


Sitting in a large room, working furiously at their laptops “”mdash; aided by an unlimited supply of caffeine and sugar ““ about 80 students spent this weekend analyzing data as part of an annual competition put on by the UCLA Department of Statistics.
Datafest, now in its second year, pits student teams against each other, giving them 48 hours to analyze a large set of data from an organization. At the conclusion of the event, teams present their analysis to a panel of judges and are evaluated based on usefulness, visualization and use of data from external sources.
“Teaching in this field is usually based around theory and questions are closed-ended, but now students are the ones who have to ask the questions,” said Akram Almohalwas, a lecturer in the statistics department.
During this year’s event, which took place from Friday to Sunday, teams analyzed data from kiva.org, a website that gives microloans to citizens in developing nations. There were dozens of variables, including the age and year of people receiving loans.
Kiva makes the information publicly available, so organizers worked with Kiva engineers to make it possible for students to analyze within a 48-hour period, said Rob Gould, a professor of statistics at UCLA who helped organize the event. Students are assisted by various professionals and graduate students throughout the course of the two days.
Datafest also hosted a team from Pomona College led by Jo Hardin, a professor of statistics at Pomona college who is on sabbatical at UCLA.
“I’ve read about events like these around the country, and knew it would be great for my students’ resumes,” Hardin said.
Victoria Stodden, a professor of statistics from Columbia University, was one of the judges for the event.
The data set was unstructured and students did not have a lot of time to dig into it, Stodden said.
“I was really impressed by what (teams) came up with in 48 hours,” she added.
Fourth-year mathematical economics student Scott Kamino and his team analyzed the loan data in relation to the borrower’s gender, focusing on the rate at which men and women repaid their loans.
David Huberman, fourth-year statistics student, was part of the team that won the “Best Visualization” category. His team’s analysis included colorful graphs and large descriptive axis labels.
Evidence-based policy-making, evidence-based medicine, banking policy, mortgages and issues in climate change are fundamentally data-driven questions, Stodden said.
“Some of our biggest questions (across society) are around data,” she said.
With contributing reports from Nikki Somani, Bruin contributor.

